Free PDF Download of CBSE Maths Multiple Choice Questions for Class8 with Answers Chapter 5 Data Handling. Maths MCQs for Class 8 Chapter Wise with Answers PDF Download was Prepared Based on Latest Exam Pattern. Students can solve NCERT Class 8 Maths Data Handling MCQs Pdf with Answers to know their preparation level.
Data Handling Class 8 Maths MCQs Pdf
1. The width or size of the class interval 30-40 is:
a) 10
b) 30
c) 40
d) 70
Answer/Explanation
Answer: (a)
Explanation: Width of class interval = upper class limit-lower class limit
= 40-30
= 10
2. If a coin is flipped in the air, what is the probability of getting a tail?
a) 0
b) ½
c) 1
d) 2
Answer/Explanation
Answer: (b)
Explanation: A coin has two sides, Head and tails.
Hence, probability = Number of possible outcomes/Total number of outcomes
We know, Tail is present on one side of a coin and in total there could be two outcomes H&T
Hence, Probability = ½
3. A bag has 4 red balls and 4 green balls, what is the probability of getting a red ball randomly?
a) 1/4
b) 1/8
c) 1/2
d) 0
Answer/Explanation
Answer: (c)
Explanation: Total number of balls in bag = 4+4 = 8
Total number of red balls = 4
Probability of getting a red ball = 4/8 = ½
4. If a die is thrown in air, the probability of getting even numbers is:
a) ½
b) ⅙
c) ⅓
d) ⅔
Answer/Explanation
Answer: (b)
Explanation: A die has six sides each consisting numbers from 1 to 6.
Number of even numbers in die = 3 (2,4,6)
Total possible outcomes = 6
Probability = 3/6 = 1/2
5. Pictorial representation of data using symbols is known as:
a) Bargraph
b) Pictograph
c) Piechart
d) None of these
Answer
Answer: (b)
6. Double bar graphs display ______ sets of data simultaneously.
a) Four
b) Three
c) Two
d) No
Answer
Answer: (c)
7. _________ gives the number of times a particular entry occurs.
a) Organisation of data
b) Collection of Data
c) Representation of Data
d) Frequency distribution table
Answer
Answer: (d)
8. In grouped data, each of the group is called:
a) Class interval
b) Collection of data
c) Frequency
d) Grouped frequency distribution
Answer
Answer: (a)
9. If 20-30 is the class interval of grouped data, then lower class limit is:
a) 50
b) 30
c) 20
d) 10
Answer
Answer: (c)
10. The difference between the upper class limit and lower class limit of a class interval is called:
a) Frequency
b) Width
c) Grouped data
d) Ungrouped data
Answer
Answer: (b)
Frequency distribution of daily income of 550 workers of a factory is given bellow
Read the table given above and answer the following questions (Q1 – Q5)
11. What is the size of class intervals?
(a) 24
(b) 25
(c) 26
(d) 15
Answer
Answer: (b)
12. Which class has the highest frequency?
(a) 200-225
(b) 300-325
(c) 175-200
(d) 150-175
Answer
Answer: (a)
13. Which class has the lowest frequency?
(a) 100-125
(b) 300-325
(c) 175-200
(d) 150-175
Answer
Answer: (b)
14. What is the upper limit of the class interval 250-275?
(a) 250
(b) 275
(c) 25
(d) 525
Answer
Answer: (b)
15. Which two classes have the same frequency?
(a) III & IV
(b) I & II
(c) II & V
(d) V & VI
Answer
Answer: (a)
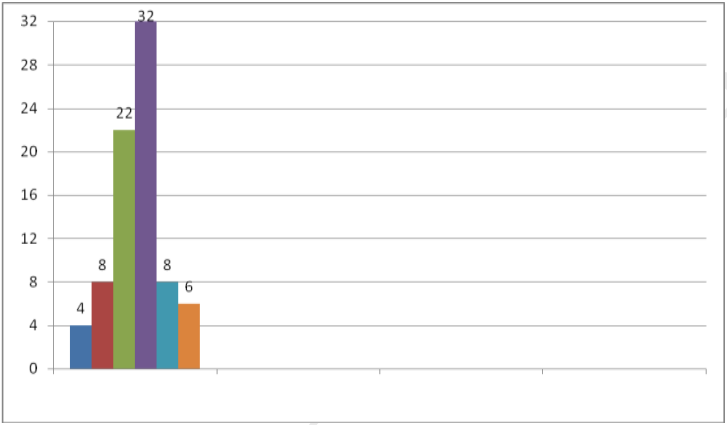
The number of hours for which students of particular class watched television during holidays is shown through the graph given below:

16. For how many hours did the maximum number of students watch TV?
(a) 4-5 hrs
(b) 6-7 hrs
(c) 3-4 hrs
(d) 2-3hrs
Answer
Answer: (a)
17. How many students watched TV for less than 4 hrs?
(a) 12
(b) 34
(c) 4
(d) 8
Answer
Answer: (b)
18. How many students spent more than 5 hrs in TV watching?
(a) 14
(b) 0
(c) 6
(d) 8
Answer
Answer: (a)
19. For how many hours did the minimum number of students watch TV?
(a) 2-3 hrs
(b) 6-7 hrs
(c) 1-2 hrs
(d) 3-4hrs
Answer
Answer: (c)
20. How many students spent less than 5 hrs in TV watching?
(a) 34
(b) 32
(c) 8
(d) 66
Answer
Answer: (d)
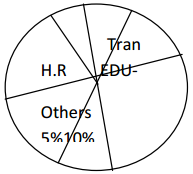
Adjoining pie-chart gives the expenditure (in %age) on various items and savings of a family during a month .
Study the given pie chart and answer the following questions (Q11-Q15)

21. On which item the expenditure was maximum?
(a) food
(b) education
(c) others
(d) transport
Answer
Answer: (a)
22. On which item the expenditure was minimum?
(a) food
(b) education
(c) others
(d) transport
Answer
Answer: (d)
23. Expenditure on which item is equal to total savings of the family?
(a) food
(b) education
(c) others
(d) transport
Answer
Answer: (b)
24. If the monthly savings of the family is Rs 3000, What is the monthly expenditure on cloths?
(a) 3000
(b) 2000
(c) 2500
(d) 1000
Answer
Answer: (b)
25. What is the monthly expenditure on education for children?
(a) 3000
(b) 2000
(c) 2500
(d) 1000
Answer
Answer: (a)
Numbers 1 to 10 are written on ten separates slips (one number on one slip ), kept in a
box and mixed well. One slip is chosen from the box without looking in to it .Answer the
following questions (Q16-Q20)
26. What is the probability of getting a number 6?
(a) 1
(b) 0
(c) \(\frac{1}{10}\)
(d) \(\frac{1}{2}\)
Answer
Answer: (c)
27. What is the probability of getting a number less than 6?
(a) 1
(b) 0
(c) \(\frac{1}{10}\)
(d) \(\frac{1}{2}\)
Answer
Answer: (d)
28. What is the probability of getting a number greater than 6?
(a) 1
(b) 0
(c) \(\frac{1}{10}\)
(d) \(\frac{2}{5}\)
Answer
Answer: (d)
29. What is the probability of getting a 1-digit number?
(a) 1 (b) 0
(c) \(\frac{1}{10}\)
(d) \(\frac{9}{10\)
Answer
Answer: (d)
30. What is the probability of getting an even number?
(a) 1
(b) 0
(c) \(\frac{1}{10}\)
(d) \(\frac{1}{2}\)
Answer
Answer: (d)
We hope the given Maths MCQs for Class 8 with Answers Chapter 5 Data Handling will help you. If you have any query regarding CBSE Class 8 Maths Data Handling MCQs Pdf, drop a comment below and we will get back to you at the earliest.
