Free PDF Download of CBSE Class 10 Maths Chapter 14 Statistics Multiple Choice Questions with Answers. MCQ Questions for Class 10 Maths with Answers was Prepared Based on Latest Exam Pattern. Students can solve NCERT Class 10 Maths Statistics MCQs with Answers to know their preparation level.
Class 10 Maths MCQs Chapter 14 Statistics
MCQ on Statistics Class 10 Question 1. One of the methods for determining mode is
(a) Mode = 2 Median -3 Mean
(b) Mode = 3 Median – 2 Mean
(c) Mode = 2 Mean – 3 Median
(d) Mode = 3 Mean – 2 Median
Answer
Statistics Class 10 MCQ with Answer: b
2. Mode is the
(a) middle most frequent value
(b) least frequent value
(c) maximum frequent value
(d) none of these
Answer
Answer: c
3. The algebraic sum of the deviations of a frequency distribution from its mean is always,
(a) greater than zero
(b) less than zero
(c) zero
(d) a non-zero number
Answer
Answer: c
MCQ Questions for Class 10 Maths Statistics Question 4. While computing mean of grouped data, we assume that the frequencies are
(a) centred at the upper limits of the classes
(b) centred at the lower limits of the classes
(c) centred at the classmarks of the classes
(d) evenly distributed over all the classes
5. Construction of a cumulative frequency table is useful in determining the
(a) mean
(b) median
(c) mode
(d) none of these
Answer
Answer: c
6. Which of the following can not be determined graphically?
(a) Mean
(b) Median
(c) Mode
(d) None of these
Answer
Answer: a
Statistics MCQ Class 10 Question 7. The absccissa of the point of intersection of the less than type and of the more than type cumulative frequency curves of a grouped data gives its
(a) Mean
(b) Median
(c) Mode
(d) None of these
Answer
Answer: b
8. For the following distribution
| C.I. | 0-10 | 10-20 | 20-30 | 30-40 | 40-50 |
| f | 20 | 30 | 24 | 40 | 18 |
the sum of lower limits of the modal class and the median class is
(a) 20
(b) 30
(c) 40
(d) 50
Answer
Answer: d
9. For the following distribution
| C.I. | 0-5 | 6-11 | 12-17 | 18-23 | 24-29 |
| f | 26 | 20 | 30 | 16 | 22 |
the upper limit of the median class is
(a) 18.5
(b) 18
(c) 17.5
(d) 17
Answer
Answer: c
MCQ of Statistics Class 10 Question 10. For the following distribution
| Marks | No. of students |
| Less than 20 | 4 |
| Less than 40 | 12 |
| Less than 60 | 25 |
| Less than 80 | 56 |
| Less than 100 | 74 |
| Less than 120 | 80 |
the modal class is
(a) 20 – 40
(b) 40 – 60
(c) 60 – 80
(d) 80 -100
Answer
Answer: c
11. For the following distribution
| Monthly Expenditure (?) | No. of families |
| Expenditure les than ? 10,000 | 15 |
| Expenditure les than ? 13,000 | 31 |
| Expenditure les than ? 16,000 | 50 |
| Expenditure les than ? 19,000 | 67 |
| Expenditure les than ?22,000 | 85 |
| Expenditure les than ?25,000 | 100 |
The number of families having expenditure range (in ?) 16,000 – 19,000 is
(a) 15
(b) 16
(c) 17
(d) 19
Answer
Answer: c
12. In the given data:
| C.I. | f |
| 65-85 | 4 |
| 85 – 105 | 5 |
| 105 – 125 | 13 |
| 125 – 145 | 20 |
| 145 – 165 | 14 |
| 165 – 185 | 7 |
| 185 – 205 | 4 |
the difference of the upper limit of the median class and the lower limit of the modal class is
(a) 38
(b) 20
(c) 19
(d) 0
Answer
Answer: b
Statistics Class 10 MCQ Question 13. For the following distribution
| Cl | 0-5 | 5-10 | 10-15 | 15-20 | 20-25 |
| f | 10 | 15 | 12 | 20 | 9 |
the difference of the upper limit of the median class and the lower limit of the modal class is
(a) 0
(b) 5
(c) 10
(d) -5
Answer
Answer: a
14. For the following distribution
| Marks | 0-10 | 10-20 | 20-30 | 30-40 | 40-50 |
| No. of students | 3 | 9 | 13 | 10 | 5 |
the number of students who got marks less than 30 is
(a) 13
(b) 25
(c) 10
(d) 12
Answer
Answer: b
15. For the following distribution
| Marks obtained | No. of students |
| More than or equal to 0 | 63 |
| More than or equal to 10 | 58 |
| More than or equal to 20 | 55 |
| More than or equal to 30 | 51 |
| More than or equal to 40 | 48 |
| More than or equal to 50 | 42 |
the frequency of the class 20-30 is
(a) 35
(b) 4
(c) 48
(d) 51
Answer
Class 10 Maths MCQ Questions with Answer: b
MCQ Questions for Class 10 Maths with Answers Question 16. The times, in seconds, taken by 150 atheletes to run a 100 m hurdle race are tabulated below:
| C.I. | f |
| 13.8-14 | 3 |
| 14 – 14.2 | 4 |
| 14.2 – 14.4 | 6 |
| 14.4 – 14.6 | 69 |
| 14.6 – 14.8 | 48 |
| 14.8-15 | 20 |
The number of atheletes who completed the race in less than 14.6 seconds is
(a) 13
(b) 69
(c) 82
(d) 130
Answer
Answer: c
17. di is the deviation of xi from assumed mean a. If mean = \(x+\frac{\sum f_{i} d_{i}}{\sum f_{i}}\), then x is
(a) class size ‘
(b) number of observations
(c) assumed mean
(d) none of these
Answer/Explanation
Answer: c
Explaination:
(c) ∵ Mean = assumed mean + \(\frac{\sum f_{i} d_{i}}{\sum f_{i}}\)
∴ x = assumed mean.
18. Mean of 100 items is 49. It was discovered that three items which should have been 60, 70, 80 were wrongly read as 40, 20, 50 respectively. The correct mean is
(a) 48
(b) 49
(c) 50
(d) 60
Answer/Explanation
Maths MCQ for Class 10 CBSE with Answer: cExplaination:
(c) Sum of 100 observations
= 100 × 49 = 4900
Correct sum
= 4900 – [40 + 20 + 50 ] + [60 + 70 + 80] = 5000
∴ Correct mean = \(\frac{5000}{100}\) = 50.
MCQ on Statistics Class 9 Question 19. Choose the correct answer from the given four options : In the formula

for finding the mean of grouped data d1 s are deviation from a of [NCERT Exemplar Problems]
(a) lower limits of the classes
(b) upper limits of the classes
(c) mid points of the classes
(d) frequencies of the class marks
Answer/Explanation
Answer: c
Explaination: (c) mid-points of the classes.
20. While computing mean of grouped data, we assume that the frequencies are [NCERT Exemplar Problems]
(a) evenly distributed over all the classes
(b) centred at the classmarks of the classes
(c) centred at the upper limits of the classes
(d) centred at the lower limits of the classes
Answer/Explanation
MCQ for Class 10 Maths with Answer: bExplaination: (b) centred at the classmarks of the classes.
CBSE Class 10 Maths MCQ Pdf Question 21. A car travels from city A to city B, 120 km apart at an average speed of 50 km/h. It then makes a return trip at an average speed of 60 km/h. It covers another 120 km distance at an average speed of 40 km/h. The average speed over the entire 360 km will be

Answer/Explanation
Answer: b
Explaination:

22. Mean of n numbers x1, x2, … xn is m. If xn is replaced by x, then new mean is

Answer/Explanation
Answer: b
Explaination:


Statistics MCQ Question 23. In the formula \(\bar{x}=a+h\left(\frac{\sum f_{i} u_{i}}{\sum f_{i}}\right)\) finding the mean of grouped frequency distribution, ui = [NCERT Exemplar Problems]

Answer/Explanation
Answer: c
Explaination: \(\frac{x_{i}-a}{h}\)
24. The abscissa of the point of intersection of the less than type and of the more than type cumulative frequency curves of a grouped data gives its [NCERT Exemplar Problems]
(a) mean
(b) median
(c) mode
(d) all the three above
Answer/Explanation
Answer: b
Explaination: median
25. For the following distribution:
| Marks | Number of Students |
| Below 10 | 3 |
| Below 20 | 12 |
| Below 30 | 27 |
| Below 40 | 57 |
| Below 50 | 75 |
| Below 60 | 80 |
the modal class is
(a) 10 – 20
(b) 20 – 30
(c) 30 – 40
(d) 50 – 60
Answer
Answer: c
26. The times, in seconds, taken by 150 atheletes to run a 110 m hurdle race are tabulated below:
| Class | Frequency |
| 13.8 – 14.0 | 2 |
| 14.0 – 14.2 | 4 |
| 14.2 – 14.4 | 5 |
| 14.4 – 14.6 | 71 |
| 14.6 – 14.8 | 48 |
| 14.8 – 15.0 | 20 |
The number of atheletes who completed the race in less then 14.6 seconds is: [NCERT Exemplar Problems]
(a) 11
(b) 71
(c) 82
(d) 130
Answer/Explanation
Answer: c
Explaination: (c) 82
27. Mode is the value of the variable which has:
(a) maximum frequency
(b) minimum frequency
(c) mean frequency
(d) middle most frequency [CBSE 2012]
Answer/Explanation
Answer: a
Explaination: (a) maximum frequency.
28. Mode and mean of a data are 12k and 15A. Median of the data is
(a) 12k
(b) 14k
(c) 15k
(d) 16k
Answer/Explanation
Answer: b
Explaination:
(b) ∵ Mode = 3 median – 2 mean
⇒ 12k = 3 median – 2 × 15k
⇒ 42k = 3 median
⇒ Median = 14k.
29. If mean = (3 median – mode) . k, then the value of k is
(a) 1
(b) 2
(C) \(\frac{1}{2}\)
(d) \(\frac{3}{2}\)
Answer/Explanation
Answer: c
Explaination:
(c) ∵ Mode = 3 median – 2 mean
⇒ 2 mean = 3 median – mode
⇒ mean = \(\frac{1}{2}\) (3 median – mode)
⇒ k= \(\frac{1}{2}\)
30. The median of set of 9 distinct observations is 20.5. If each of the largest 4 observations of the set is increased by 2, then the median of the new set
(a) is increased by 2
(b) is decreased by 2
(c) is two times of the original number
(d) Remains the same as that of the original set.
Answer/Explanation
Answer: d
Explaination:
(d) No. of observations = 9
∴ median = 5th observation
∵ The largest four observations are increased
∴ 5th observation remains unchanged.
Maths Multiple Choice Questions with Answers for Class 10 Question 31. The median from the table is
| Value | Frequency |
| 7 | 2 |
| 8 | 1 |
| 9 | 4 |
| 10 | 5 |
| 11 | 6 |
| 12 | 1 |
| 13 | 3 |
(a) 11
(b) 10
(c) 12
(d) 11.5
Answer/Explanation
Answer:
Explaination:

32. The relationship between mean, median and mode for a moderately skewed distribution is
(a) mode = median – 2 mean
(b) mode = 3 median – 2 mean
(c) mode = 2 median – 3 mean
(d) mode = median – mean
Answer/Explanation
Answer: b
Explaination: (b) Mode = 3 median – 2 mean
33. The abscissa of the point of intersection
of both types (less than & more than) of cumulative frequency curves help in finding
(a) mean
(b) median
(c) mode
(d) None of these
Answer
Answer: b
34. Cumulative frequency curve is also called
(a) histogram
(b) ogive
(c) bar graph
(d) median
Answer
Answer: b
35. The A.M. of a set of 50 numbers is 38. If two numbers of the set namely 55 and 45 are discarded, the A.M. of the remaining set of numbers is ______ .
Answer/Explanation
Answer:
Explaination: 37.5
36. If x is the mean of a distribution, then Σfi(xi – x) is eclual t0 _____ .
Answer/Explanation
Answer:
Explaination: (zero)
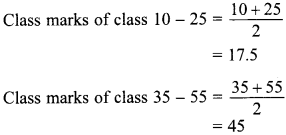
Maths MCQ for Class 10 CBSE with Answers Pdf Question 37. Find the class marks of classes 10 – 25 and 35 – 55.
Answer/Explanation
Answer:
Explaination:
38. If Σfi = 11, Σfixi = 2p + 52 and the mean of any distribution is 6, find the value of p.
Answer/Explanation
Answer:
Explaination:

39. A set of numbers consists of four 5’s, six 7’s, ten 9’s, eleven 12’s, three 13’s, two 14’s. The mode of this set of numbers is ____ .
Answer/Explanation
Answer:
Explaination: 12
40. The mode of the numbers 2, 3, 4, 4. 3, 5, 3, 6 is ______ .
Answer/Explanation
Answer:
Explaination: 3
41. Find the value of x, if the mode of the following data is 25.
15, 20, 25, 18, 14, 15, 25, 15, 18, 16, 20. 25, 20, x, 18
Answer/Explanation
Answer:
Explaination:
| Observations | Tally Marks | f |
| 14 | 1 | 1 |
| 15 | III | 3 |
| 16 | 1 | 1 |
| 18 | III | 3 |
| 20 | III | 3 |
| 25 | III | 3 |
Observations 15,18,20, and 25 all have the same frequency i.e., 3. For 25 be the mode of the data it should have the maximum frequency.
∴ 25 should repeat itself at least once more i.e., x should be 25.
42. If the mode of a data is 18 and the mean is 24. then median is _____ .
Answer/Explanation
Answer:
Explaination: Median = \(\frac{66}{3}\) = 22.
43. Construction of cumulative frequency table is useful in determining the
Answer/Explanation
Answer:
Explaination: Median
Statistics Questions And Answers for Class 10 Question 44. In an arranged series of an even number of 2n terms the median is _______.
Answer/Explanation
Answer:
Explaination: mean of nth term and (n + 1)th term
45.
| x | f | c.f. |
| 1 | 8 | 8 |
| 2 | 10 | 18 |
| 3 | 11 | 29 |
| 4 | 16 | 45 |
| 5 | 20 | 65 |
| 6 | 25 | 90 |
| 7 | 15 | 105 |
| 8 | 9 | 114 |
| 9 | 6 | 120 |
Find the median distribution.
Answer/Explanation
Answer:
Explaination:
n = 120
⇒ \(\frac{n}{2}\) = 60
∴ Median is average of 60th and 61st observation
⇒ Median =\(\frac{5+5}{2}\) = 5
46.
| Marks | Number of students |
| 0 and above | 80 |
| 10 and above | 77 |
| 20 and above | 72 |
| 30 and above | 65 |
| 40 and above | 55 |
| 50 and above | 43 |
| 60 and above | 28 |
| 70 and above | 16 |
| 80 and above | 10 |
| 90 and above | 8 |
| 100 and above | 0 |
Write the proper data (marks) and frequency (Number of students).
Answer/Explanation
Answer:
Explaination:
| Marks | Frequency |
| 0 – 10 | 3 |
| 10 – 20 | 5 |
| 20 – 30 | 7 |
| 30 – 40 | 10 |
| 40 – 50 | 12 |
| 50 – 60 | 15 |
| 60 – 70 | 12 |
| 70 – 80 | 6 |
| 80 – 90 | 2 |
| 90 – 100 | 8 |
47. Find the median class of the following data:
| Marks obtained | Frequency |
| 0-10 | 8 |
| 10-20 | 10 |
| 20-30 | 12 |
| 30-40 | 22 |
| 40-50 | 30 |
| 50-60 | 18 |
Answer/Explanation
Answer:
Explaination:

48. There are ____ types of cumulative frequency curve.
Answer/Explanation
Answer:
Explaination: two
49. Which measure of central tendency is given by the x-coordinate of the point of intersection of the “more than ogive” and “less than ogive”?
Answer/Explanation
Answer:
Explaination: Median
50. In drawing ogive, cumulative frequencies are marked on _____ axis.
Answer/Explanation
Answer:
Explaination: y
51. Which measure of central tendency is given by the x-coordinate of the point of intersection of “more than ogive”.and “less than ogive”?
Answer/Explanation
Answer:
Explaination: Median
We hope the given MCQ Questions for Class 10 Maths Statistics with Answers will help you. If you have any query regarding CBSE Class 10 Maths Chapter 14 Statistics Multiple Choice Questions with Answers, drop a comment below and we will get back to you at the earliest.