Selina Concise Mathematics Class 8 ICSE Solutions Chapter 22 Data Handling
Selina Publishers Concise Mathematics Class 8 ICSE Solutions Chapter 22 Data Handling
Data Handling Exercise 22A – Selina Concise Mathematics Class 8 ICSE Solutions
Question 1.
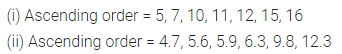
Arrange the following data as an array (in ascending order):
(i) 7, 5, 15, 12, 10, 11, 16
(ii) 6.3, 5.9, 9.8, 12.3, 5.6, 4.7
Solution:

Question 2.
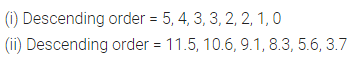
Arrange the following data as an array (descending order):
(i) 0 2, 0, 3, 4, 1, 2, 3, 5
(ii) 9.1, 3.7, 5.6, 8.3, 11.5, 10.6
Solution:

Question 3.
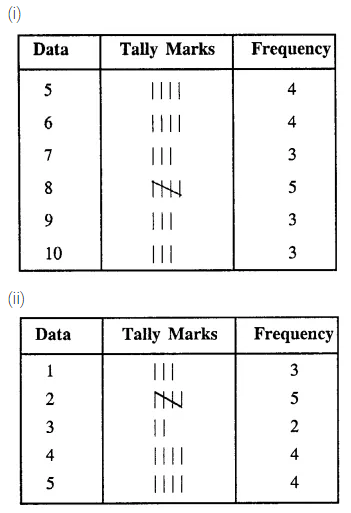
Construct a frequency table for the following data:
(i) 6, 7, 5, 6, 8, 9, 5, 5, 6, 7, 8, 9, 8, 10, 10, 9, 8, 10, 5, 7, 6, 8.
(ii) 3, 2, 1, 5, 4, 3, 2, 5, 5, 4, 2, 2, 2, 1, 4, 1, 5, 4.
Solution:

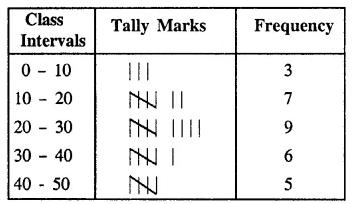
Question 4.
Following are the marks obtained by 30 students in an examinations.
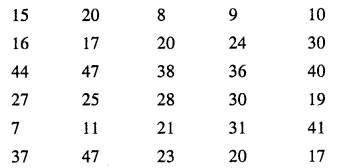
Taking class intervals 0-10, 10-20, ……… 40-50 ; construct a frequency table.
Solution:


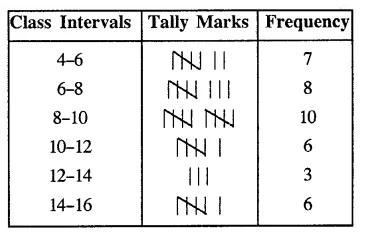
Question 5.
Construct a frequency distribution table for the following data ; taking class-intervals 4-6, 6-8, ……… 14-16.
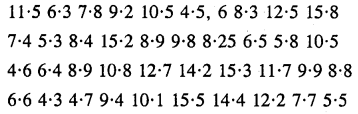
Solution:


Question 6.
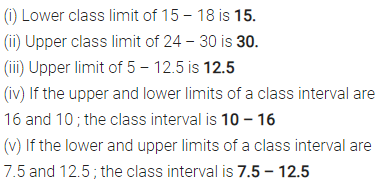
Fill in the blanks:
(i) Lower class limit of 15-18 is ………
(ii) Upper class limit of 24-30 is ……..
(iii) Upper limit of 5-12.5 is ………
(iv) If the upper and the lower limits of a class interval are 16 and 10 ; the class-interval is ……..
(v) If the lower and the upper limits of a class interval are 7.5 and 12.5 ; the class interval is ……..
Solution:

Data Handling Exercise 22B – Selina Concise Mathematics Class 8 ICSE Solutions
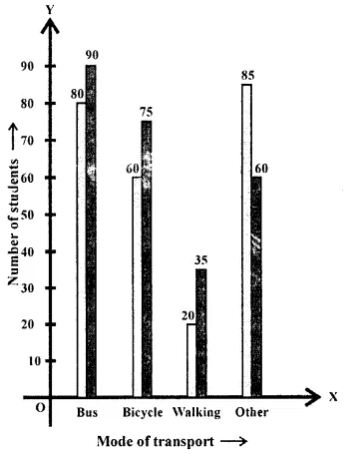
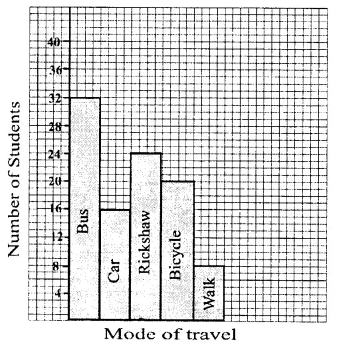
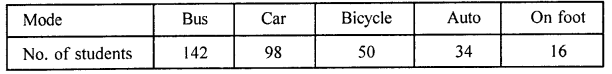
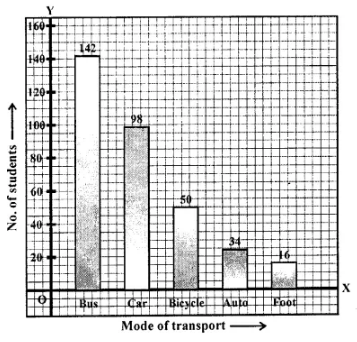
Question 1.
Hundred students from a certain locality use different modes of travelling to school as given below. Draw a bar graph.
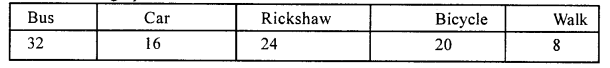
Solution:


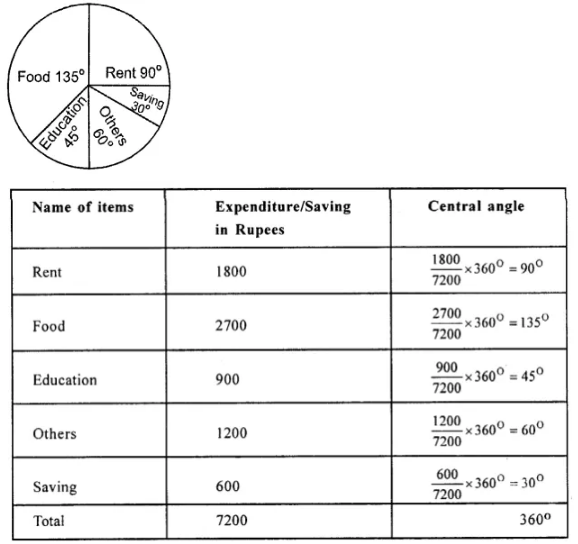
Question 2.
Mr. Mirza’s monthly income is Rs. 7,200. He spends Rs. 1,800 on rent, Rs. 2,700 on food, Rs. 900 on education of his children ; Rs. 1,200 on Other things and saves the rest.
Draw a pie-chart to represent it.
Solution:

Question 3.
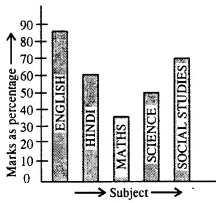
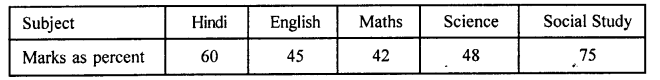
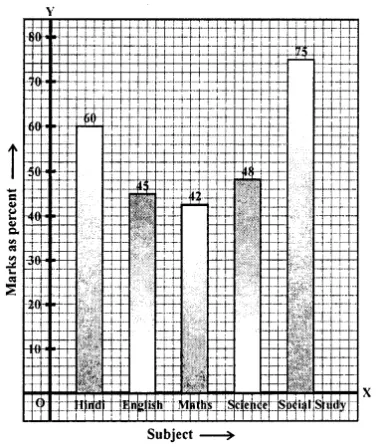
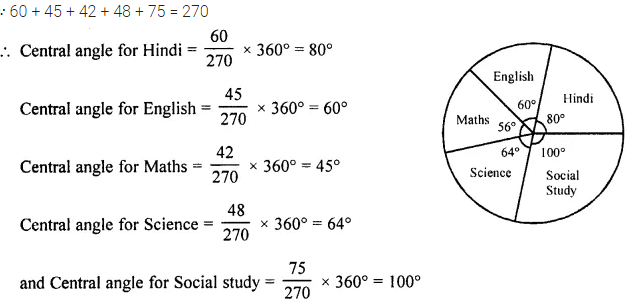
The percentage of marks obtained, in different subjects by Ashok Sharma (in an examination) are given below. Draw a bar graph to represent it.
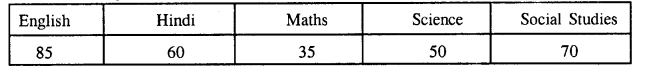
Solution:


Question 4.
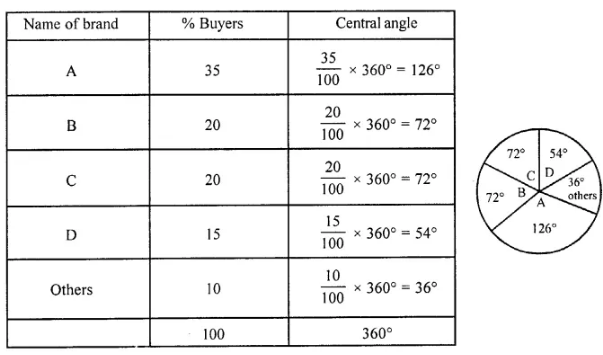
The following table shows the market position of different brand of tea-leaves.
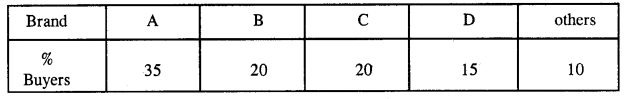
Draw it-pie-chart to represent the above information.
Solution:


Question 5.
Students of a small school use different modes of travel to school as shown below:
Draw a suitable bar graph.
Solution:


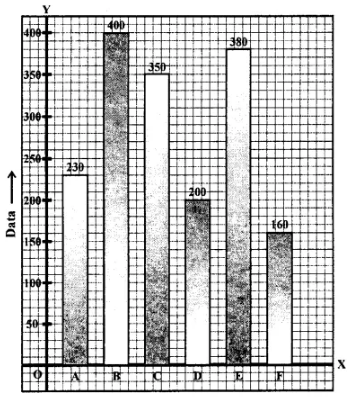
Question 6.
For the following table, draw a bar-graph
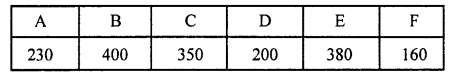
Solution:


Question 7.
Manoj appeared for ICSE examination 2018 and secured percentage of marks as shown in the following table:
Represent the above data by drawing a suitable bar graph.
Solution:


Question 8.
For the data given above in question number 7, draw a suitable pie-graph.
Solution:

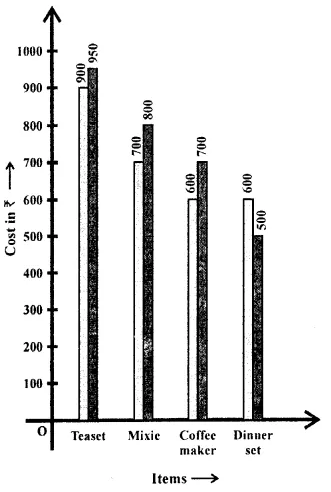
Question 9.
Mr. Kapoor compares the prices (in Rs.) of different items at two different shops A and B. Examine the following table carefully and represent the data by a double bar graph.
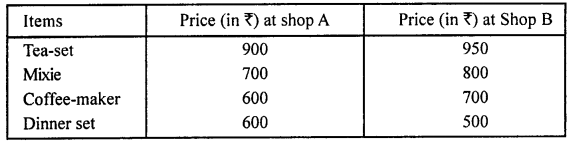
Solution:


Question 10.
The following tables shows the mode of transport used by boys and girls for going to the same school.
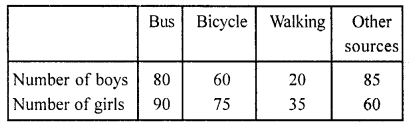
Draw a double bar graph representing the above data.
Solution: