ML Aggarwal Class 10 Solutions for ICSE Maths Chapter 21 Measures of Central Tendency MCQS
ML Aggarwal Class 10 Solutions for ICSE Maths Chapter 21 Measures of Central Tendency MCQS
Choose the correct answer from the given four options (1 to 16):
Question 1.
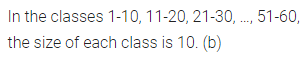
If the classes of a frequency distribution are 1-10, 11-20, 21-30, …, 51-60, then the size of each class is
(a) 9
(b) 10
(c) 11
(d) 5.5
Solution:

Question 2.
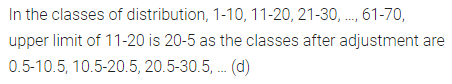
If the classes of a frequency distribution are 1-10, 11-20, 21-30,…, 61-70, then the upper limit of the class 11-20 is
(a) 20
(b) 21
(c) 19.5
(d) 20.5
Solution:

Question 3.
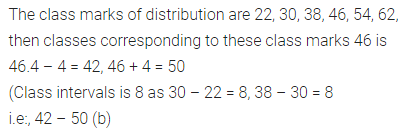
If the class marks of a continuous frequency distribution are 22, 30, 38, 46, 54, 62, then the class corresponding to the classmark 46 is
(a) 41.5-49.5
(b) 42-50
(c) 41-49
(d) 41-50
Solution:

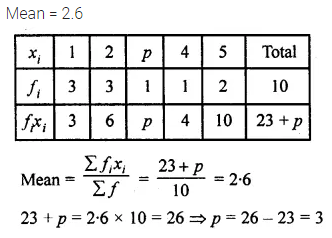
Question 4.
If the mean of the following distribution is 2.6,
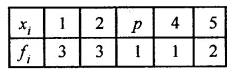
then the value of P is
(a) 2
(b) 3
(c) 2.6
(d) 2.8
Solution:


Question 5.
The measure of central tendency of statistical data which takes into account all the data is
(a) mean
(b) median
(c) mode
(d) range
Solution:
![]()

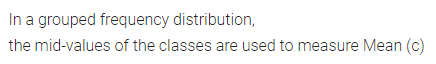
Question 6.
In a grouped frequency distribution, the mid-values of the classes are used to measure which of the following central tendency?
(a) median
(b) mode
(c) mean
(d) all of these
Solution:

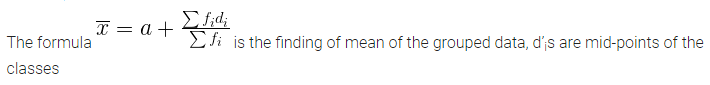
Question 7.
In the formula: \(\overline { x } =a+\frac { \sum { { f }_{ i }{ d }_{ i } } }{ \sum { { f }_{ i } } } \) for finding the mean of the grouped data, d’is are deviations from a (assumed mean) of
(a) lower limits of the classes
(b) upper limits of the classes
(c) mid-points of the classes
(d) frequencies of the classes
Solution:

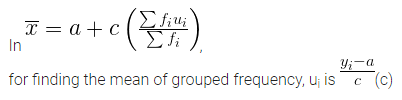
Question 8.
In the formula: \(\overline { x } =a+c\left( \frac { \sum { { f }_{ i }{ u }_{ i } } }{ \sum { { f }_{ i } } } \right) \), for finding the mean of grouped frequency distribution, ui =
(a) \(\frac { { y }_{ i }+a }{ c } \)
(b) \(c({ y }_{ i }-a)\)
(c) \(\frac { { y }_{ i }-a }{ c } \)
(d) \(\frac { a-{ y }_{ i } }{ c } \)
Solution:

Question 9.
While computing mean of grouped data, we assumed that the frequencies are
(a) evenly distributed over all the classes
(b) centred at the class marks of the classes
(c) centred at the upper limits of the classes
(d) centred at the lower limits of the classes
Solution:

Question 10.
Construction of a cumulative frequency distribution table is useful in determining the
(a) mean
(b) median
(c) mode
(d) all the three measures
Solution:

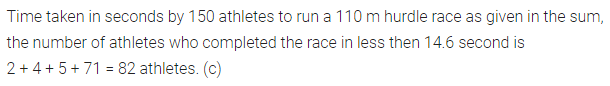
Question 11.
The times, in seconds, taken by 150 athletes to run a 110 m hurdle race are tabulated below:
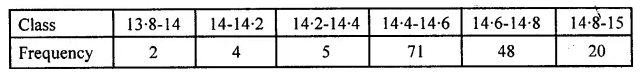
The number of athletes who completed the race in less than 14.6 seconds is
(a) 11
(b) 71
(c) 82
(d) 130
Solution:


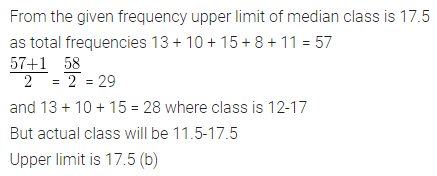
Question 12.
Consider the following frequency distribution:
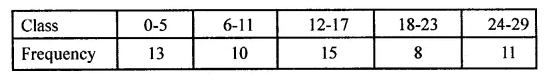
The upper limit of the median class is
(a) 17
(b) 17.5
(c) 18
(d) 18.5
Solution:


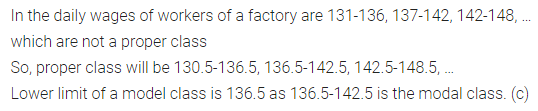
Question 13.
Daily wages of factory workers are recorded as:
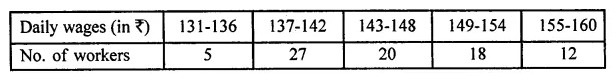
The lower limit of the modal class is
(a) Rs 137
(b) Rs 143
(c) Rs 136.5
(d) Rs 142.5
Solution:


Question 14.
For the following distribution:
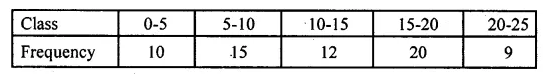
The sum of lower limits of the median class and modal class is
(a) 15
(b) 25
(c) 30
(d) 35
Solution:


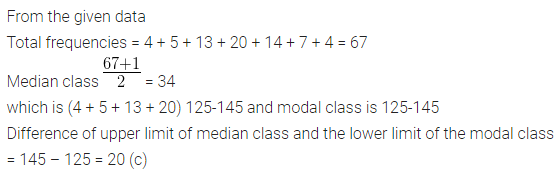
Question 15.
Consider the following data:
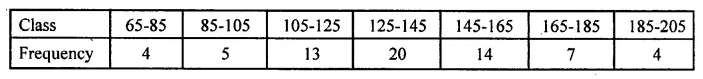
The difference of the upper limit of the median class and the lower limit of the modal class is
(a) 0
(b) 19
(c) 20
(d) 38
Solution:


Question 16.
An ogive curve is used to determine
(a) range
(b) mean
(c) mode
(d) median
Solution:
![]()
