ML Aggarwal Class 10 Solutions for ICSE Maths Chapter 21 Measures of Central Tendency Ex 21.4
ML Aggarwal Class 10 Solutions for ICSE Maths Chapter 21 Measures of Central Tendency Ex 21.4
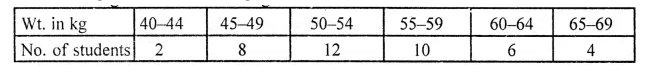
Question 1.
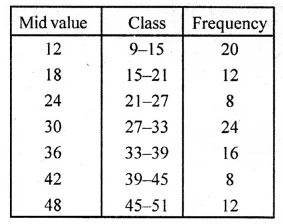
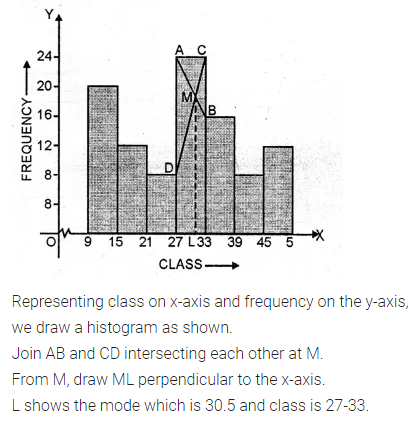
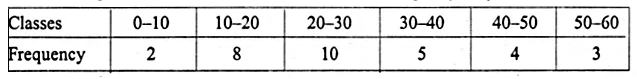
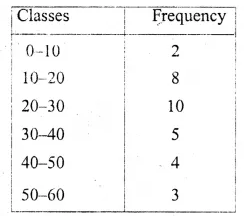
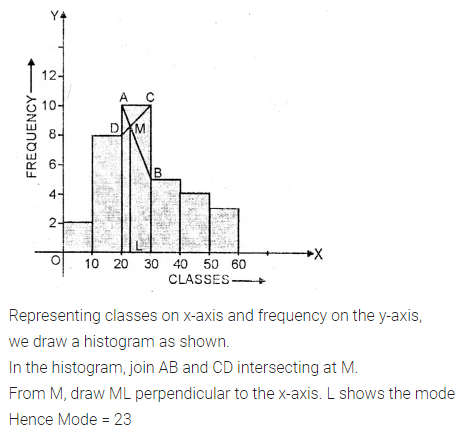
Draw a histogram for the following frequency distribution and find the mode from the graph :
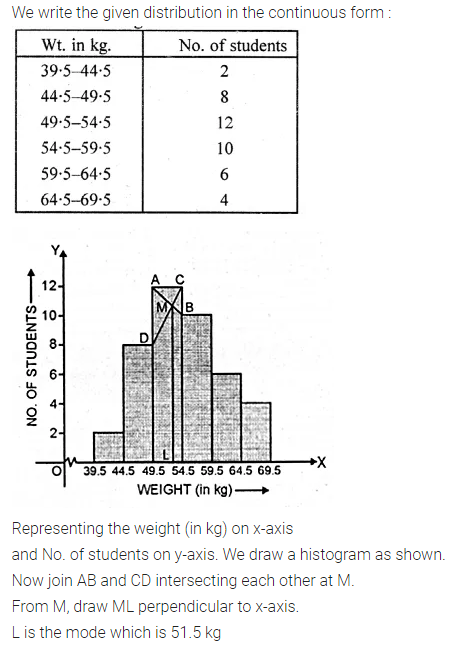
Solution:


Question 2.
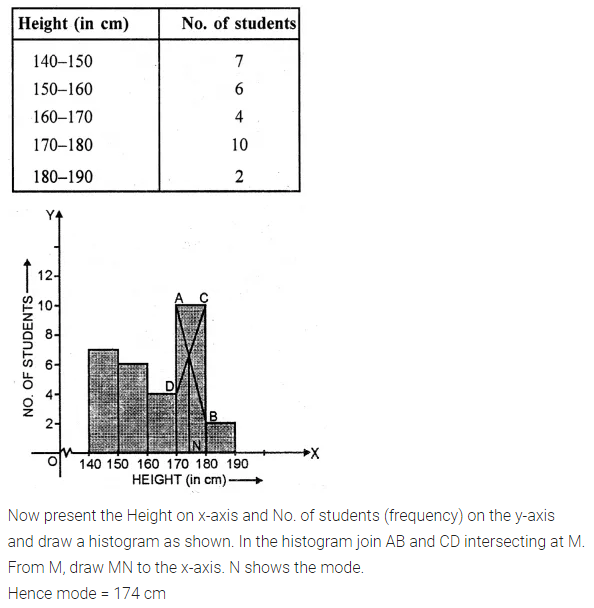
Find the modal height of the following distribution by drawing a histogram :
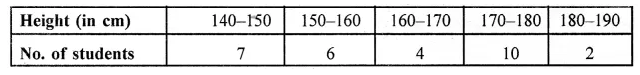
Solution:


Question 3.
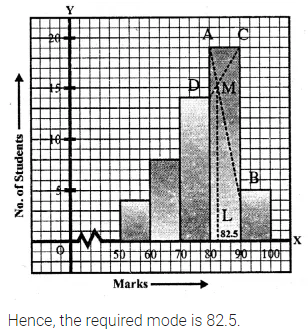
A Mathematics aptitude test of 50 students was recorded as follows :
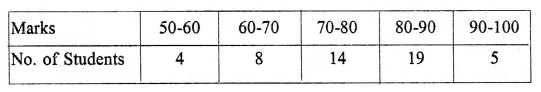
Draw a histogram for the above data using a graph paper and locate the mode. (2011)
Solution:


Question 4.
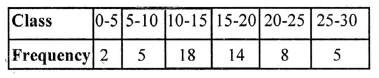
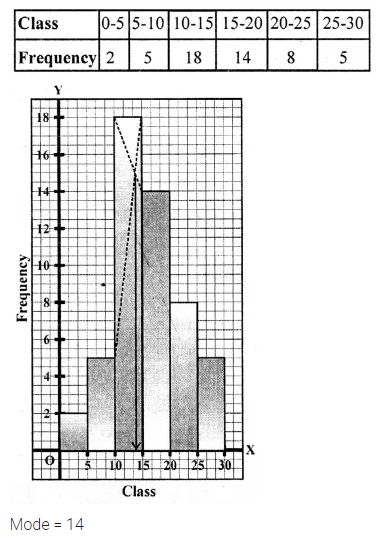
Draw a histogram and estimate the mode for the following frequency distribution :
Solution:


Question 5.
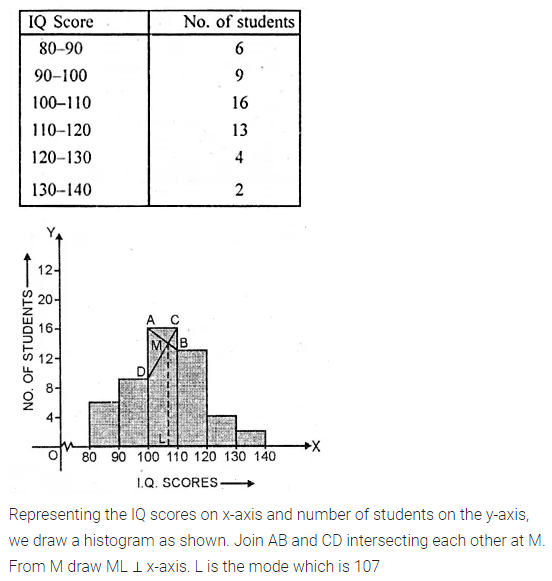
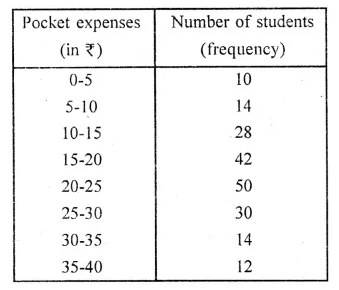
IQ of 50 students was recorded as follows
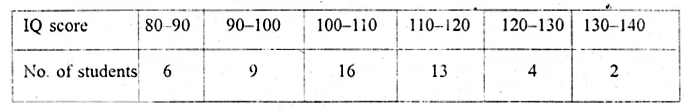
Draw a histogram for the above data and estimate the mode.
Solution:


Question 6.
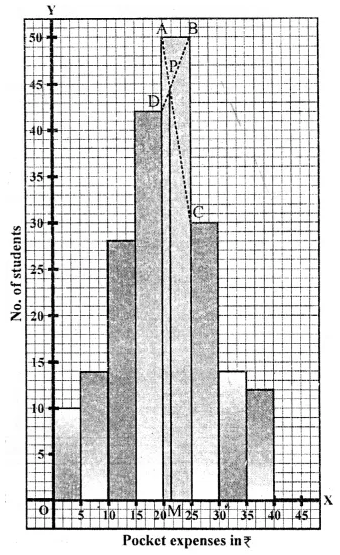
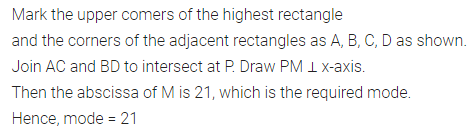
Use a graph paper for this question. The daily pocket expenses of 200 students in a school are given below:
Draw a histogram representing the above distribution and estimate the mode from the graph.
Solution:


Question 7.
Draw a histogram for the following distribution :
Hence estimate the modal weight.
Solution:


Question 8.
Find the mode of the following distribution by drawing a histogram
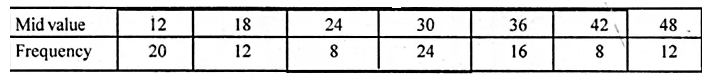
Also, state the modal class.
Solution: